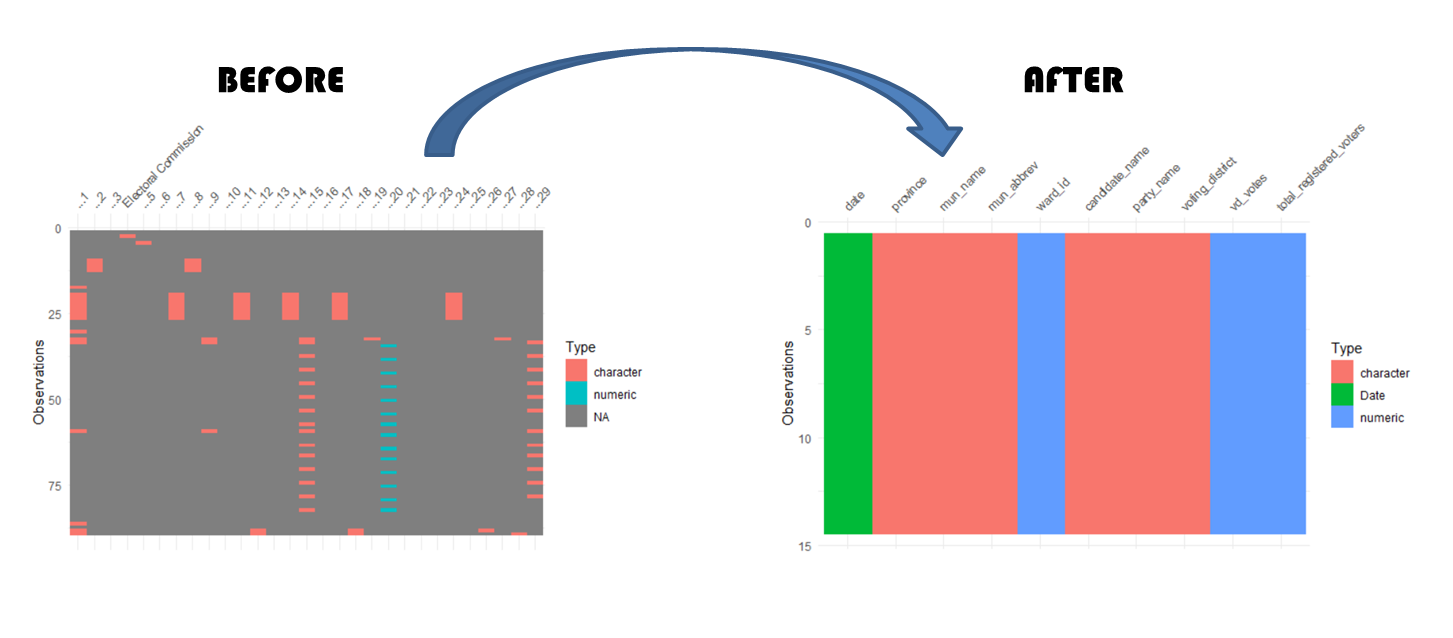
The Data is in the Details

Extract data from Excel files

r
democracy
excel
Author

Gavin Masterson

Published

March 5, 2021

Image Created By: Gavin Masterson

Mission Impossible?

I want to analyse data on a recent by-election that took place on 11 November 2020, in 95 municipal wards across South Africa. Unfortunately for me, the IEC provides the raw data for results of each ward’s by-election in a single .xls file containing both the ward details and the results in human-readable format. Each file must be manually downloaded (Hint: remember this fact for later). When we open the downloaded files we see that each file contains numerous blank rows, merged rows, merged columns, and cells that are actually variable names in rows other than the first. This formatting prevents me from simply using the read* functions in R.

dplyr::glimpse(readxl::read_xls("output (1).xls"))
Rows: 89
Columns: 29
$ ...1                   <chr> NA, NA, NA, NA, NA, NA, NA, NA, NA, NA, NA, NA,…
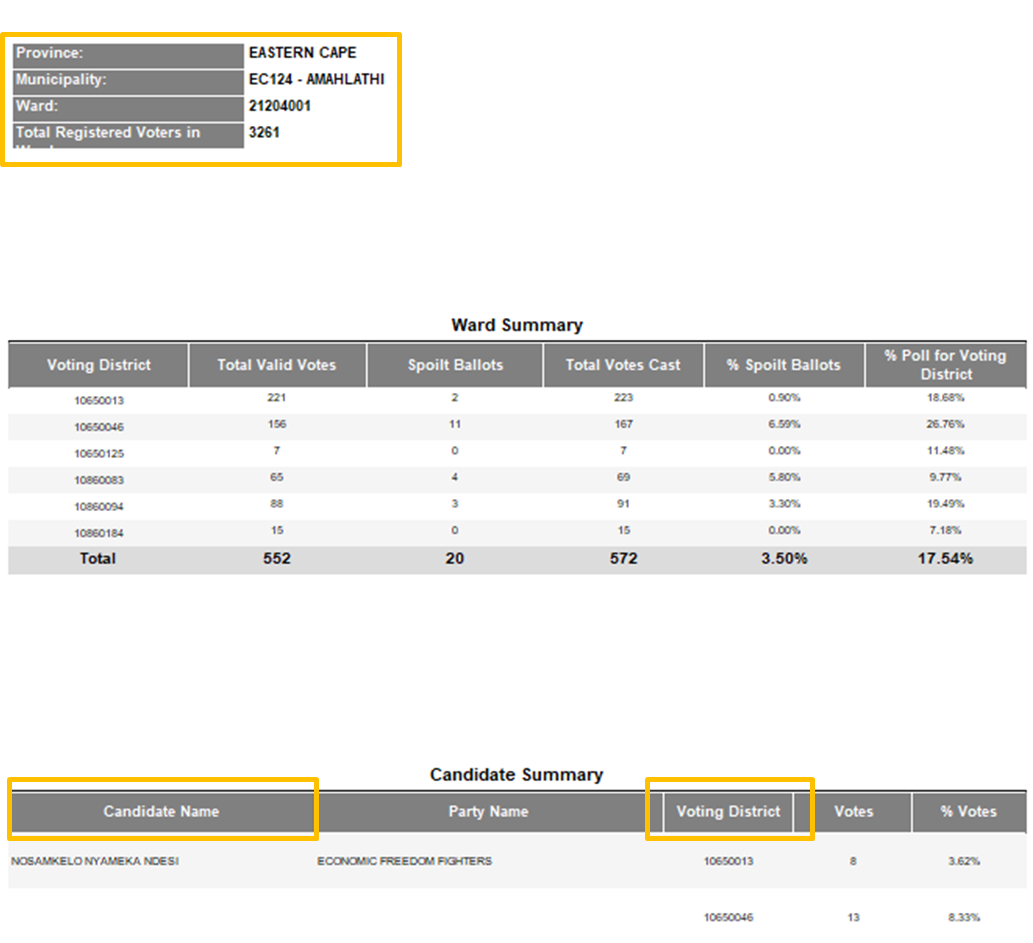
$ ...2                   <chr> NA, NA, NA, NA, NA, NA, NA, NA, "Province:", "M…
$ ...3                   <lgl> NA, NA, NA, NA, NA, NA, NA, NA, NA, NA, NA, NA,…
$ `Electoral Commission` <chr> NA, "BY-ELECTIONS 11 Nov 2020 RESULTS REPORT", …
$ ...5                   <chr> NA, NA, NA, "Results as on: 2020/12/06 2:12:39 …
$ ...6                   <lgl> NA, NA, NA, NA, NA, NA, NA, NA, NA, NA, NA, NA,…
$ ...7                   <chr> NA, NA, NA, NA, NA, NA, NA, NA, NA, NA, NA, NA,…
$ ...8                   <chr> NA, NA, NA, NA, NA, NA, NA, NA, "EASTERN CAPE",…
$ ...9                   <chr> NA, NA, NA, NA, NA, NA, NA, NA, NA, NA, NA, NA,…
$ ...10                  <lgl> NA, NA, NA, NA, NA, NA, NA, NA, NA, NA, NA, NA,…
$ ...11                  <chr> NA, NA, NA, NA, NA, NA, NA, NA, NA, NA, NA, NA,…
$ ...12                  <chr> NA, NA, NA, NA, NA, NA, NA, NA, NA, NA, NA, NA,…
$ ...13                  <lgl> NA, NA, NA, NA, NA, NA, NA, NA, NA, NA, NA, NA,…
$ ...14                  <chr> NA, NA, NA, NA, NA, NA, NA, NA, NA, NA, NA, NA,…
$ ...15                  <chr> NA, NA, NA, NA, NA, NA, NA, NA, NA, NA, NA, NA,…
$ ...16                  <lgl> NA, NA, NA, NA, NA, NA, NA, NA, NA, NA, NA, NA,…
$ ...17                  <chr> NA, NA, NA, NA, NA, NA, NA, NA, NA, NA, NA, NA,…
$ ...18                  <chr> NA, NA, NA, NA, NA, NA, NA, NA, NA, NA, NA, NA,…
$ ...19                  <chr> NA, NA, NA, NA, NA, NA, NA, NA, NA, NA, NA, NA,…
$ ...20                  <dbl> NA, NA, NA, NA, NA, NA, NA, NA, NA, NA, NA, NA,…
$ ...21                  <lgl> NA, NA, NA, NA, NA, NA, NA, NA, NA, NA, NA, NA,…
$ ...22                  <lgl> NA, NA, NA, NA, NA, NA, NA, NA, NA, NA, NA, NA,…
$ ...23                  <lgl> NA, NA, NA, NA, NA, NA, NA, NA, NA, NA, NA, NA,…
$ ...24                  <chr> NA, NA, NA, NA, NA, NA, NA, NA, NA, NA, NA, NA,…
$ ...25                  <lgl> NA, NA, NA, NA, NA, NA, NA, NA, NA, NA, NA, NA,…
$ ...26                  <chr> NA, NA, NA, NA, NA, NA, NA, NA, NA, NA, NA, NA,…
$ ...27                  <chr> NA, NA, NA, NA, NA, NA, NA, NA, NA, NA, NA, NA,…
$ ...28                  <chr> NA, NA, NA, NA, NA, NA, NA, NA, NA, NA, NA, NA,…
$ ...29                  <chr> NA, NA, NA, NA, NA, NA, NA, NA, NA, NA, NA, NA,…

As you can see, a straight import of the file into R results in a jumble of strangely-named, mostly NA variables with one or two information values scattered throughout the rows. But that’s not all! The ‘best part’ is that the rows containing the desired information change between files depending on the characteristics of the ward that it is describing e.g. different numbers of voting districts or candidates up for election etc. The silver lining here is that read_xls does read the file with no errors. This gives us a starting point and something to work with.

The Plan

I want to import the results contained in each of the 95 .xls files into R. In my former life, I would have considered capturing the data manually. Now that I have limited time (and more wisdom), I will just write a function that takes the chaos of each file, processes it and presents me with a complete, tidy dataframe/tibble.

Step 1: Eyeball the Spreadsheets

Before I can piece together my function, I need to know if there is a reliable structure in each of the 95 spreadsheets for me to hook my function into. It turns out that even though the files have lots of white-space as well as different row layouts, there is consistency in the naming of each section.

An Example .xls File

The first orange square highlights the ward metadata, database identifier and total registered voters at the time of the election. This section begins at the cell labelled "Province:". The second orange square indicates where the actual vote results begin. This section is laid out in table format from the heading "Candidate Name". We see here that each candidate’s name is used just once in the table so the data is not tidy and we will have to come back to this after import. The third square indicates that the variable voting district is included in this table and is repeated for each candidate in the ward. In other words this section contains the raw data at the finest grain possible.

Step 2: Extract the Indices

library(tidyverse)
library(readxl)
library(janitor)
library(gt)

With the ability to read the file into R and knowledge of the files’ structural consistency, we can now extract the row indices of the cell containing "Province:" and "Candidate Name". From the glimpse above we see that "Province:" is in the second variable. The code below imports the file, ascertains which row contains "Province:", "Candidate Name" and also "By-Election Ward Winner". From the code you might correctly guess that this is the label of the last row in each table of vote results. We don’t need this line, as it is a derived value, so we subtract the index of the starting row (- i) to obtain n-max as the number of rows to read in after the start row.

dummy <- read_xls("output (1).xls")
j <- which(dummy[,2] == "Province:")
i <- min(which(dummy[,1] == "Candidate Name"))
n_max <- which(dummy[,1] == "By-Election Ward Winner") - i

Step 3: Capture the Ward Details

Next we want to extract the ward details into a table. Using j from above, we slice the original tibble and keep just the two columns we want.

dummy2 <- slice(dummy, j:(j + 3)) %>%
          select(detail = ...2,
                 value = ...8)

Next we build a tibble containing these details. There are two extra things we can do now. The first is that we add the date of the by-election, because while most of the ward details will probably not change over time, the number of registered_voters almost certainly will! The second is to separate the municipality variable into each of its two components - the abbreviation of the municipality name (mun_abbrev) and the full name (mun_name).

details <- tibble(date = "11 November 2020",
                      province = dummy2$value[1],
                      municipality = dummy2$value[2],
                      ward_id = dummy2$value[3],
                      registered_voters = dummy2$value[4]) %>%
           separate(municipality,
                    into = c("mun_abbrev", "mun_name"),
                    sep = " - ",
                    remove = TRUE)

details %>%
  gt() %>%
  tab_options(table.font.size = 10)
date province mun_abbrev mun_name ward_id registered_voters
11 November 2020 EASTERN CAPE EC124 AMAHLATHI 21204001 3261

Step 4: Capture the Vote Results

The next step is to create a file with the data of the vote results for each candidate. The solution I settled on was to use i and n_max to re-import the result rows from the same .xls file that generated them. The benefit of this approach is that the imported tibble will us the table headings in the .xls file as the variable names. The code below imports the results to an object named data, filters out rows containing only NA values using the new if_any function from dplyr v1.04, removes all NA columns, and then renames the two variables where the names were not correctly specified during import.

data <- read_xls("output (1).xls",
                 skip = i,
                 n_max = n_max - 1) %>%
        filter(if_any(everything(), ~!is.na(.x))) %>% 
        select(!where(is.logical)) %>%
        rename(vd_votes = ...20,
               vd_percent = ...29) %>%
        clean_names()
head(data) %>% gt() %>% tab_options(table.font.size = 11)
candidate_name party_name voting_district vd_votes vd_percent
NOSAMKELO NYAMEKA NDESI ECONOMIC FREEDOM FIGHTERS 10650013 NA 3.62%
NA NA NA 8 NA
NA NA 10650046 NA 8.33%
NA NA NA 13 NA
NA NA 10650125 NA 0.00%
NA NA NA 0 NA

The next small issue is that each candidate has a row containing their Total votes across all voting_districts. We don’t need this as we can derive it as needed, so we slice the data to remove each instance of a Total row.

x <- which(data$voting_district == "Total")
data <- slice(data, -x)

This is looking good, but we still have to deal with the NA values interspersed throughout the rows. For simplicity, I decided to pull each variable to a vector object and use drop_na.

candidate_name <- data %>% select(candidate_name) %>% drop_na() %>% pull()
party_name <- data %>% select(party_name) %>% drop_na() %>%  pull()
voting_district <- data %>% select(voting_district) %>% drop_na() %>% pull()
vd_votes <- data  %>% select(vd_votes) %>% drop_na() %>% pull()
vd_percent <- data %>% select(vd_percent) %>% drop_na() %>% pull() %>% str_replace_all("%","")

Merge the two tibbles

We’re almost there, but we have to deal with the issue I mentioned right at the start - each candidate’s name only appears once in the results table. We need each candidate_name to appear in each row of voting_district results. The code below identifies the number of voting districts in the ward, which we will then use to build the final tibble.

rep <- dim(data %>%
       filter(is.na(voting_district) == FALSE) %>%
       distinct(voting_district))[1]

At last we can put all the data together in a single tibble! The only thing worth noting here is the vectorised nature of R. We are combining vectors of length = >1 from data with vectors of length = 1 from details. This is fine because the length = 1 vectors are simply repeated for each row of the tibble. We also use str_to_title to convert each character vector from upper case to title style (first letter of each word capitalised).

final_data <- tibble(
    date = details$date,
    province = str_to_title(details$province),
    mun_name = str_to_title(details$mun_name),
    mun_abbrev = details$mun_abbrev,
    ward_id = details$ward_id,
    candidate_name = str_to_title(rep(candidate_name, each = rep)),
    party_name = str_to_title(rep(party_name, each = rep)),
    voting_district = voting_district,
    vd_votes = vd_votes,
    vd_percent = vd_percent,
    total_registered_voters = details$registered_voters)

head(final_data) %>% gt() %>% tab_options(table.font.size = 11)
date province mun_name mun_abbrev ward_id candidate_name party_name voting_district vd_votes vd_percent total_registered_voters
11 November 2020 Eastern Cape Amahlathi EC124 21204001 Nosamkelo Nyameka Ndesi Economic Freedom Fighters 10650013 8 3.62 3261
11 November 2020 Eastern Cape Amahlathi EC124 21204001 Nosamkelo Nyameka Ndesi Economic Freedom Fighters 10650046 13 8.33 3261
11 November 2020 Eastern Cape Amahlathi EC124 21204001 Nosamkelo Nyameka Ndesi Economic Freedom Fighters 10650125 0 0.00 3261
11 November 2020 Eastern Cape Amahlathi EC124 21204001 Nosamkelo Nyameka Ndesi Economic Freedom Fighters 10860083 6 9.23 3261
11 November 2020 Eastern Cape Amahlathi EC124 21204001 Nosamkelo Nyameka Ndesi Economic Freedom Fighters 10860094 1 1.14 3261
11 November 2020 Eastern Cape Amahlathi EC124 21204001 Nosamkelo Nyameka Ndesi Economic Freedom Fighters 10860184 0 0.00 3261

Completing the Mission

We now have a complete, tidy tibble of all the information we want.

!! MISSION ACCOMPLISHED !!

… actually not yet…

I set out to write a function that will import ALL THE FILES and process them. We need to take the code above which is essentially an R script and make it a function. Thankfully, this is not too difficult.

The final version of the function is shown below. If you are not familiar with writing your own functions, you can skip to the bottom to continue reading about how to convert the script to the function.

read_iec_ber <- function(
  file, 
  details_start = "Province:", 
  result_start = "Candidate Name",
  result_end = "By-Election Ward Winner",
  date = "11 November 2020"){

    # Specify the packages required in our function code:

    require(readxl)
    require(dplyr)
    require(stringr)
    require(tidyr)
    require(janitor)
    require(readr)
    require(here)

    # Use a dummy file read to extract the municipal info and obtain key 
    # array indices for the actual data import

    dummy <- read_xls(file)
    j <- which(dummy[,2] == details_start)
    dummy2 <- slice(dummy, j:(j+3)) %>%
      select(detail = ...2, value = ...8)

    # Create a tibble of the municipal and ward details

    details <- tibble(
        date = date,
        province = dummy2$value[1],
        municipality = dummy2$value[2],
        ward_id = dummy2$value[3],
        registered_voters = dummy2$value[4]
      ) %>%
      separate(
        municipality,
        into = c("mun_abbrev", "mun_name"),
        sep = " - ",
        remove = TRUE
      )

    # Indices of the start and end rows which bound the voting data

    i <- min(which(dummy[,1] == result_start))
    n_max <- which(dummy[,1] == result_end) - i

    # Use the above row indices to read in the ward vote results

    data <- read_xls(
        file,
        skip = i,
        n_max = n_max - 1
      ) %>%
      filter(
        if_any(everything(), ~ !is.na(.x))
      ) %>%
      select(
        !where(is.logical)
      ) %>%
      rename(vd_votes = ...20, vd_percent = ...29) %>%
      clean_names()

    # Remove the rows containing subtotals for each voting district

    x <- which(data$voting_district == "Total")
    data <- slice(data, -x)

    # Create individual vectors with their specific NAs removed

    candidate_name <- data %>% 
      select(candidate_name) %>% 
      drop_na() %>% 
      pull()
    party_name <- data %>%
      select(party_name) %>%
      drop_na() %>%
      pull()
    voting_district <- data %>% 
      select(voting_district) %>% 
      drop_na() %>% 
      pull()
    vd_votes <- data  %>%
      select(vd_votes) %>%
      drop_na() %>%
      pull()
    vd_percent <- data %>%
      select(vd_percent) %>%
      drop_na() %>%
      pull() %>%
      str_replace_all("%","")

    # Determine the number of times that the candidate name and party name 
    # must be repeated in order to make the data tidy when we build 
    # the complete tibble

    rep <- dim(data %>%
           filter(is.na(voting_district) == FALSE) %>%
           distinct(voting_district))[1]

    # Create the complete tidy tibble

    final_data <- tibble(
      date = details$date,
      province = details$province,
      mun_name = details$mun_name,
      mun_abbrev = details$mun_abbrev,
      ward_id = details$ward_id,
      candidate_name = rep(candidate_name, each = rep),
      party_name = rep(party_name, each = rep),
      voting_district = voting_district,
      vd_votes = vd_votes,
      vd_percent = vd_percent,
      total_registered_voters = details$registered_voters)

    # Write the tibble to the disk with the ward number as its name 
    # i.e. "{ward_id}.xls"

    file_name <- paste0(
      c(
        here::here("data/tidy/"),
        "/",
        details$ward_id[1],
        ".csv"
      ),
      collapse = ""
    )
    
    write_csv(final_data, file_name, append = FALSE)
}

“I’m Calling It!”

To use the function, we need simply need to provide a filepath or list of filepaths to the function. The code below generates the list of filepaths for the 96 .xls files in the relevant folder.

file_list <- list.files(
  path = here::here("data/ward_results"), 
  pattern = "xls$"
  )

Finally, because it is a list, we use lapply to run the function for each file in the list. If you look at the empty folder found at ../super_wednesday/data/tidy while the function runs, you can watch the files being written to the folder.

df <- lapply(
  file.path(here::here("data/ward_results"),
  file_list),
  read_iec_ber
  )

The df object is a list with the data from each of the 96 files… Wait… there were only 95 wards in the by-election so we must have a duplicated file somewhere. I must have downloaded two results files for one of the wards and then Windows simply assigned it to an unused output (x).xls path. I don’t want to open each file and try and figure out which ward is duplicated, so instead I will use the anyDuplicated function (which I learned about when this actually did happen in my workflow). The code below shows us that output (65).xls is a duplicated file and can be deleted.

(Sidenote: The benefit of writing files using the ward_id variable for the name is taht I only wrote 95 unique files to disk. The duplicate simply overwrote the original.)

file_list[anyDuplicated(df)]
## [1] "output (65).xls"

Now it really is:

!! MISSION ACCOMPLISHED !!

Thank you for reading.

I hope this post has helped you to see silver linings and possibilities when confronted by data in human-friendly presentation formats.

Happy coding!

Appendix: Converting Scripts to Functions

Quick reminder:
A function has a name, arguments and code. The code below shows how they fit together. The function call is used to tell R that we are creating an object called name which is a function. The arguments indicate those data which the user must specify, unless they have a default value specified. If a default value is specified, the argument can be left out when the function is called.

<NAME> <- function(argument1,
                   argmuent2, 
                   argument3 = <DEFAULT VALUE>){
  
      <THE FUNCTION CODE GOES HERE>
  
      }

For my function the code looks like this:

read_iec_ber <- function(
  file, 
  details_start = "Province:", 
  result_start = "Candidate Name",
  result_end = "By-Election Ward Winner",
  date = "11 November 2020"){
      
    <MY AWESOME CODE>
    
  }

The function is called read_iec_ber (where the “ber” stands for “by-election result”). The arguments are:

  • file: a path to the file that the function will process,
  • details_start: a character string indicating starting row of the ward details in the file,
  • results_start: a character string indicating the starting row of the results table in the file,
  • results_end: a character string indicating the end row of the results table in the file,
  • date: the date of the by-election that the file is from.

For each argument other than file, I specified a default value. These values may need to be changed in future by-elections but it simplifies the function call in this case.

The first section of function code simply specifies the packages that the function needs to expect to use functions from.

# Specify the packages required in our function code:

  require(readxl)
  require(dplyr)
  require(stringr)
  require(tidyr)
  require(janitor)
  require(readr)
  require(here)

The main chunk of the code comes directly from the script shown in each stage in the main post.

  # Use a dummy file read to extract the municipal info and obtain key 
  # array indices for the actual data import

  dummy <- read_xls(file)
  j <- which(dummy[,2] == details_start)
  dummy2 <- slice(dummy, j:(j+3)) %>%
    select(detail = ...2, value = ...8)

  # Create a tibble of the municipal and ward details

  details <- tibble(
      date = date,
      province = dummy2$value[1],
      municipality = dummy2$value[2],
      ward_id = dummy2$value[3],
      registered_voters = dummy2$value[4]
    ) %>%
    separate(
      municipality,
      into = c("mun_abbrev", "mun_name"),
      sep = " - ",
      remove = TRUE
    )

  # Indices of the start and end rows which bound the voting data

  i <- min(which(dummy[,1] == result_start))
  n_max <- which(dummy[,1] == result_end) - i

  # Use the above row indices to read in the ward vote results

  data <- read_xls(
      file,
      skip = i,
      n_max = n_max - 1
    ) %>%
    filter(
      if_any(everything(), ~ !is.na(.x))
    ) %>%
    select(
      !where(is.logical)
    ) %>%
    rename(vd_votes = ...20, vd_percent = ...29) %>%
    clean_names()

  # Remove the rows containing subtotals for each voting district

  x <- which(data$voting_district == "Total")
  data <- slice(data, -x)

  # Create individual vectors with their specific NAs removed

  candidate_name <- data %>% 
    select(candidate_name) %>% 
    drop_na() %>% 
    pull()
  party_name <- data %>%
    select(party_name) %>%
    drop_na() %>%
    pull()
  voting_district <- data %>% 
    select(voting_district) %>% 
    drop_na() %>% 
    pull()
  vd_votes <- data  %>%
    select(vd_votes) %>%
    drop_na() %>%
    pull()
  vd_percent <- data %>%
    select(vd_percent) %>%
    drop_na() %>%
    pull() %>%
    str_replace_all("%","")

  # Determine the number of times that the candidate name and party name must be
  # repeated in order to make the data tidy when we build the complete tibble

  rep <- dim(data %>%
          filter(is.na(voting_district) == FALSE) %>%
          distinct(voting_district))[1]

  # Create the complete tidy tibble

  final_data <- tibble(
    date = details$date,
    province = details$province,
    mun_name = details$mun_name,
    mun_abbrev = details$mun_abbrev,
    ward_id = details$ward_id,
    candidate_name = rep(candidate_name, each = rep),
    party_name = rep(party_name, each = rep),
    voting_district = voting_district,
    vd_votes = vd_votes,
    vd_percent = vd_percent,
    total_registered_voters = details$registered_voters)

The last section takes the data and writes it to a uniquely named .csv file which can be imported with any appropriate read* function. In this iteration, the written file uses the ward_id number as its name. I expect that I will add the by-election date to each file in the future.

  # Write the tibble to the disk with the ward number as its name 
  # i.e. "{ward_id}.xls"

  file_name <- paste0(
    c(here::here("data/tidy/"),
    "/",
    details$ward_id[1],
    ".csv"),
    collapse = "")

  write_csv(final_data, file_name, append = FALSE)