Data Science with {pins}
Data Sharing in Distributed and Polyglot Settings
First Things First…
It’s Data-Sharing Day!
I have some data to share with you.
# python -m pip install pins
import pins
base_url = "https://gavinmasterson.com/pins"
pin_paths = {
  "snake_detections": "snake_detections/20240730T195415Z-6c718/",
  "snake_top_five": "snake_top_five/20240730T195447Z-2039f/",
  }
board = pins.board_url(base_url, pin_paths)
board.pin_list()
# Investigate individual data sets
board.pin_meta("snake_detections")
board.pin_read("snake_detections")Data Science in 2024
The Power of Networks
Our human experience is defined by our connections…
- to ourselves,
- to each other,
- to nature,
- to places.
Our connections ground us, teach us, and enable us.
The Power of Networks
A single computer is powerful.
A network of computers is unlimited.1
Data on a single computer is useful.
Data shared throughout a network can change everything.2
A Tough Choice?

A Tough Choice?
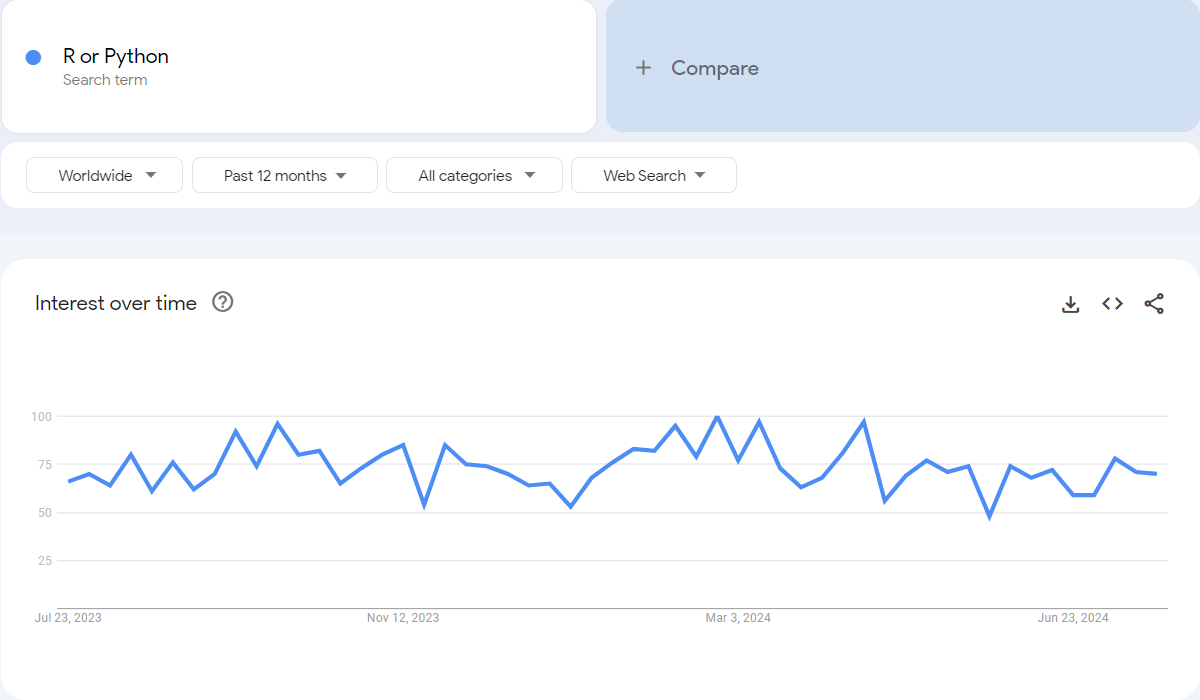
“R or Python” is a consistent search query:

A Tough Choice?
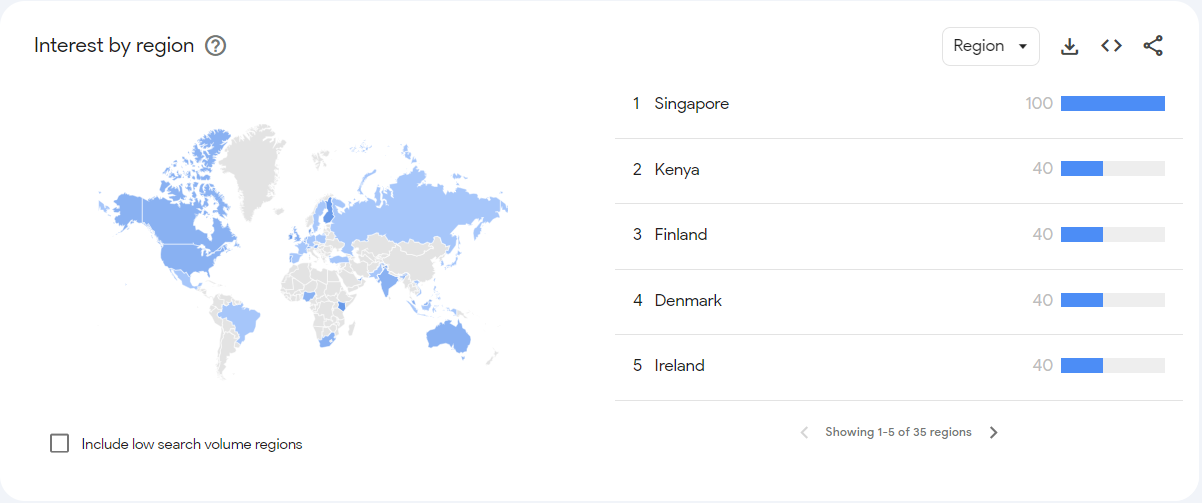
Apparently a ‘high stakes’ decision in Singapore:

Why Not Both?
- All coding languages have strengths and weaknesses
- Polyglot teams can:
- blend the strengths of different coding languages,
- chunk workflows into stages which connect to others.
- Connections create opportunities:
- Web scrape with
Playwright=> Visualise withggplot2. - Model with
tidymodels=> Dashboard withStreamlit.
- Web scrape with
Sharing Data with {pins}
One API to Connect Them All
- {pins} is a package created by Posit.
- There are versions for Python and R that have a similar API.
- The goal of {pins} is to facilitate the sharing of data, models, or any file.
In this presentation, I will demonstrate a workflow to:
- create a pin board,
- write files to the board,
- add metadata about the files/file versions.
Follow Along
You can run this workflow locally, with the same data that I have used.
Creating Boards
In my website project I create a directory named ‘pins’ then:
board_folder()creates a board inside a folder. You can use this to share files by using a folder on a shared network drive or inside a DropBox.1
Writing Data
Writing Updated Data
If we add a new field to the data, we might break code that uses the previous version of snake_detections in our pin board.
This is where the versioned argument shines.
Let us add the observer_id field to our data frame:
Writing Updated Data
Now we write the new data frame as a new version of the snake_detections pin:
Writing Updated Data
Now we write the new data frame as a new version of the snake_detections pin:
Same Data, Different Pin
What if consumers want just the top five most-frequently detected species of the snake_detections pin? For example, if the dataset is very large, or you want to share a training dataset for a model.
- Creating a new version of
snake_detectionswith fewer species will cause confusion/break some user’s code. - Solution: Pin the subset as a new object.
The Top 5 Detected Species
Let us subset the full dataset:
snakes_top_5 <-
  snake_data |>
  count(common_name, sort = TRUE) |>
  head(5) |>
  semi_join(x = snake_data, y = _, by = "common_name")
Note
We pass the modified snake_data object to the y argument of semi_join using the _ placeholder for R’s base pipe. (The near-equivalent of . with magrittr’s %>%)
If we do not, the semi_join step does nothing.
The Top 5 Detected Species
Now we can write snakes_top_5 to our board as a new pin:
The Top 5 Detected Species
Now we can write snakes_top_5 to our board as a new pin:
View the Board State
We have used pin_write() three times, to pin:
- The first version of
snake_detections, with all the data. - A new version of
snake_detectionsthat includes anobserver_id. - A subset of the
snake_detectionsdata, which we namedsnake_top_five.
View the Board State
To view the state of the board, we can use the following code:
Pin Management
Next we can add a manifest file to our board.
The manifest is a yaml file that helps users to navigate through our board.
From what I can tell, the navigation of the folder does not depend on the manifest file, so this part of the workflow will depend on personal preference.
Pin Management
A board manifest file records all the pins, along with their versions, stored on a board. This can be useful for a board built using, for example,
board_folder()orboard_s3(), then served as a website, such that others can consume usingboard_url(). The manifest file is not versioned like a pin is, and this function will overwrite any existing_pins.yamlfile on your board. It is your responsibility as the user to keep the manifest up to date (emphasis added).1
Pin Management
In R, we can generate a manifest for our board using:
The function outputs a _pins.yaml file to the root of our board folder. The manifest file for our board looks like this:
Pin Management
Note
There is no Python equivalent of write_board_manifest() at present.
If desired, the file can be created manually to match the structure of _pins.yaml shown previously.
Success!
The workflow I have demonstrated here is the exact process I used to share the snake-detections.csv data via my website in the form of two, versioned, {pins} objects.
Get the Pin from my board_url()
Here is the same code we used at the start of the presentation:
# python -m pip install pins
import pins
base_url = "https://gavinmasterson.com/pins"
pin_paths = {
  "snake_detections": "snake_detections/20240730T195415Z-6c718/",
  "snake_top_five": "snake_top_five/20240730T195447Z-2039f/",
  }
board = pins.board_url(base_url, pin_paths)
board.pin_list()
# Investigate individual data sets
board.pin_meta("snake_detections")
board.pin_read("snake_detections")Next Steps
Use Other Board Types
There are many other board_* functions to use.1
Here are some of functions to create pin boards using cloud services/folders:
board_azureboard_gcsboard_gdriveboard_ms365board_s3
Use Other Data Types
In this demonstration, I have stored csv data in json format. There are many other formats to choose.
Files can be stored as one of:
csvjsonparquetarrowrdsorqs(R binary formats)joblib(Python module for parallel computation)
Use Custom Data Types
Custom data formats (not specified previously) can be pinned to boards.1
To write custom file types to a board, use pin_upload.
To get a custom file from a board, use pin_download2.
Using {pins} for these files allows you to integrate them into your data science workflows.
Bonus: Deploying a Board with Quarto
To serve my pin board on my Quarto1 website, I have modified the header of my _quarto.yml file to look like this:
_quarto.yml
The directories/files listed under the resources keyword are rendered into my website when using quarto render.